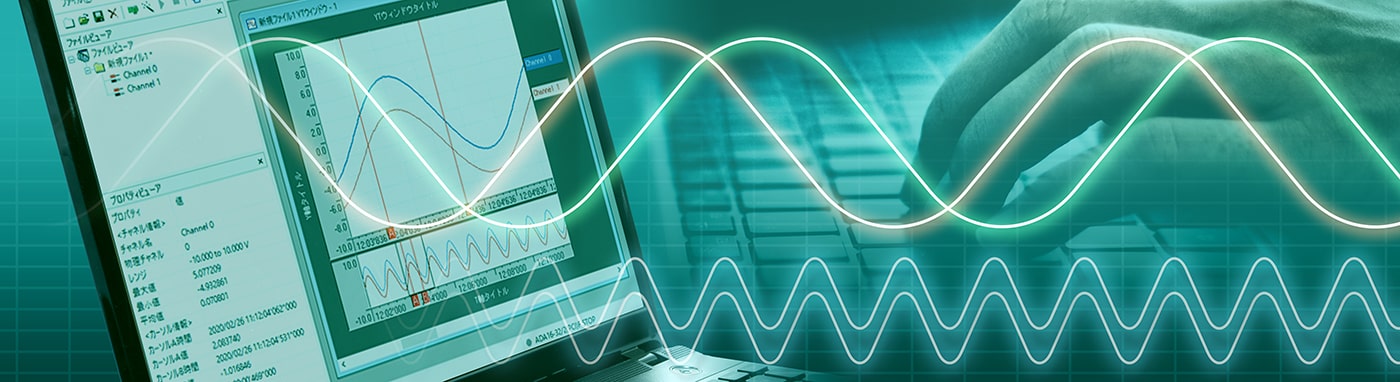
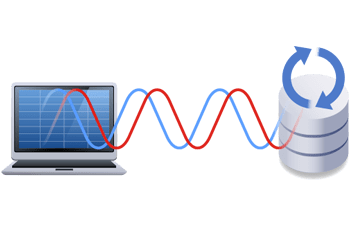
Why not use your laptop as a data logger?
We will show you how to combine Contec's USB analog input device with free data logger software, C-LOGGER, and use it as a data logger.
- Simply add an analog device to your PC to use it as a data logger.
- The data logger software C-LOGGER is available free of charge and the installation procedure is described here.
- Since the acquired analog data is stored on a PC, it is easy to use and has high affinity, including linking it to other software.
This article provides illustrated instructions on how to set up a PC to use it as a data logger.
Configuration of the system used in this article
■Features of the C-LOGGER Data Logger Software
High-speed sampling and graphing
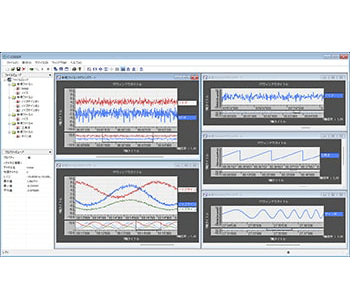
Multiple graph window display
Interactive format (wizard) for
easy setting of sampling conditions
Function to customize data display graphs
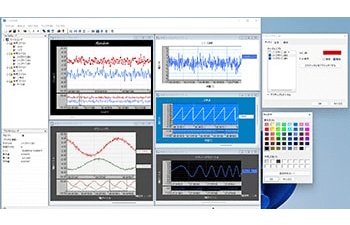
Function to customize data display graphs
Long time and large data collection by automatic saving
■Step 3: How to Use C-LOGGER
Start C-LOGGER.
Double-click the shortcut icon created on the desktop.
You can also start it by clicking “Start menu” - “Programs” - “CONTEC Data Logger” - “C-LOGGER” in that order.
3.1 Selecting the device
Select the device to be used for data collection.
Select “Device (D)” - “Select (S)” from the menu bar to launch the Select Device dialog. Alternatively, you can select the “Select Device” shortcut icon on the toolbar.
From the combo box in the upper left corner of the screen, select the device to be used for data collection. Select AI-1608GY-USB [Device name + AIO000 (default)], which was checked in “Step 2: C-LOGGER Setup.” Click “OK” to set the device.
Only the device name has been set here.
Setting other items is performed in the next procedure: “3.2 Setting data collection conditions.”
3.2 Setting data collection conditions
Selecting a device allows you to set data collection conditions. All settings for data collection conditions are done through an interactive interface called the Collection Wizard.
Select “Device (D)” - “Wizard (W)” from the menu bar to start the Collection Wizard. Alternatively, you can select the “Collection Wizard” shortcut icon on the toolbar.
■Starting the Collection Wizard■
The first page to load the collection condition setup file will be displayed.
Click “Next.”
*
If you use the same conditions as in the settings file, click the Finish button after loading the file to close the Collection Wizard, but in this case, do not load the file and click Next to proceed.
■Channel Setup■
Configure settings related to input method and device channels (number of channels, range, channel name, scale setting, and channel order).
As an example, leave the default settings unchanged and click “Next” to proceed.
The settings are outlined below.
Input Type;SingleEnded
Sampling Channels Setup
Seauence;1
Range;-10to10V(±10)
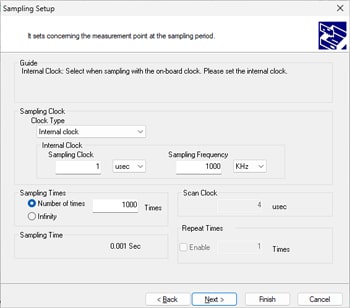
■Sampling Setup■
Sets the clock type, sampling count, conversion speed, and repeat count.
Select the internal or external clock by clock type.
When the internal clock is set, the sampling speed can be set in terms of period or frequency.
If you set one of the easier settings, the other will automatically change in conjunction with the other.
Click here for detailed explanations on how to determine the period (sampling period) and frequency (sampling frequency).
In this case, we will acquire a 10 Hz sine wave, so we will acquire 1000 data with a sampling frequency of 1 KHz.
【Setting values for this sample】
Clock type;Internal clock
・Sampling Clock;1mSec
・Sampling frequency;1KHz
Sampling Times
・Finite
・1000 times
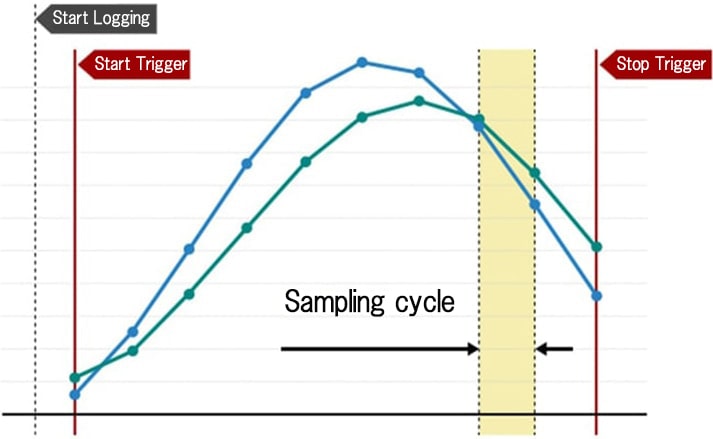
■Start Trigger Setup■
Set the start trigger, which is the condition for starting data collection.
The start trigger is the condition for starting data collection,
and after clicking the Start Collection button, data collection starts when the start trigger condition is satisfied.
C-LOGGER does not store or display data from the start of collection to the start trigger.
If “None” is set, the collection starts immediately after the Start Collection button is clicked.
The settings required for each start trigger are different.
In this case, set the start trigger to “None.”
■Stop Trigger Setup■
Set the stop trigger, which is the condition for stopping data collection.
Data collection stops when the stop trigger condition is satisfied.
If the sampling count was set to Finite in the Sampling Settings window, the stop trigger cannot be selected except for “None” (collection stop command stop, count end).
The settings required for each stop trigger are different.
In this case, “None” is set because the sampling count is enabled.
■Data Saving Setup■
To save the collected data, specify a saving location.
The file for automatic saving can be either a CSV file or a C-LOGGER-only file.
Excel transfer cannot be used at higher speeds.
In this case, we will set it so that not all types of files are saved.
Completing the Collection Wizard
The settings made in the Collection Wizard will be displayed.
To save the setting conditions, click the Save button. In the dialog box that appears, name and save the file.
If you want to set the same conditions in the future, you can load the settings file in the Collection Wizard Start screen to set the same conditions.
If there are no problems with the settings, click the “Finish” button to exit the wizard.
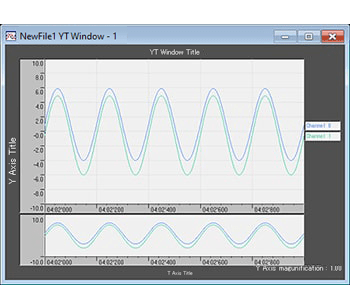
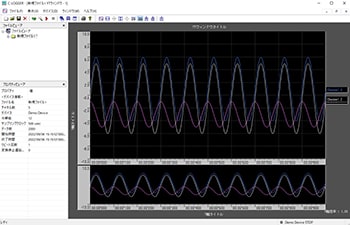
When the Collection Wizard is completed, a single graph window (hereafter “YT window”) will be created that displays time on the x-axis (hereafter “T-axis”) and voltage and current on the y-axis.
The File Viewer and Property Viewer will display the conditions set in the Collection Wizard.
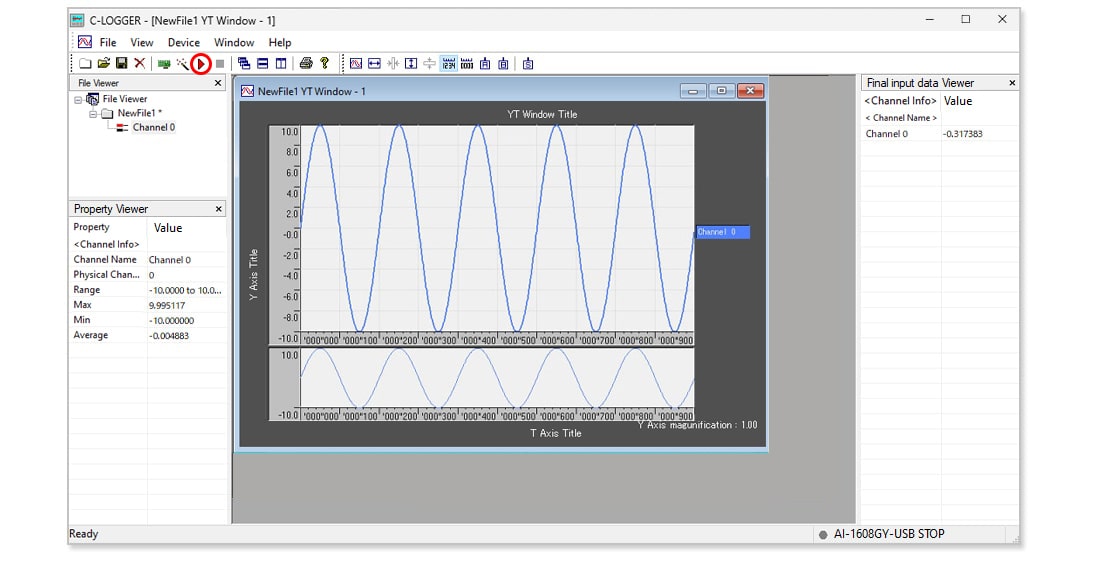
3.3 Start and stop collection
Click “Start ” on the toolbar to start data collection.
The collected data is displayed in a graph in the YT window.
Data collection will stop when the finite number of times finishes or by clicking “Stop .”
.”
*
The same operation can be performed with “Device (D)” - “
Start” or “
Stop” on the menu bar.
3.4 Data observation
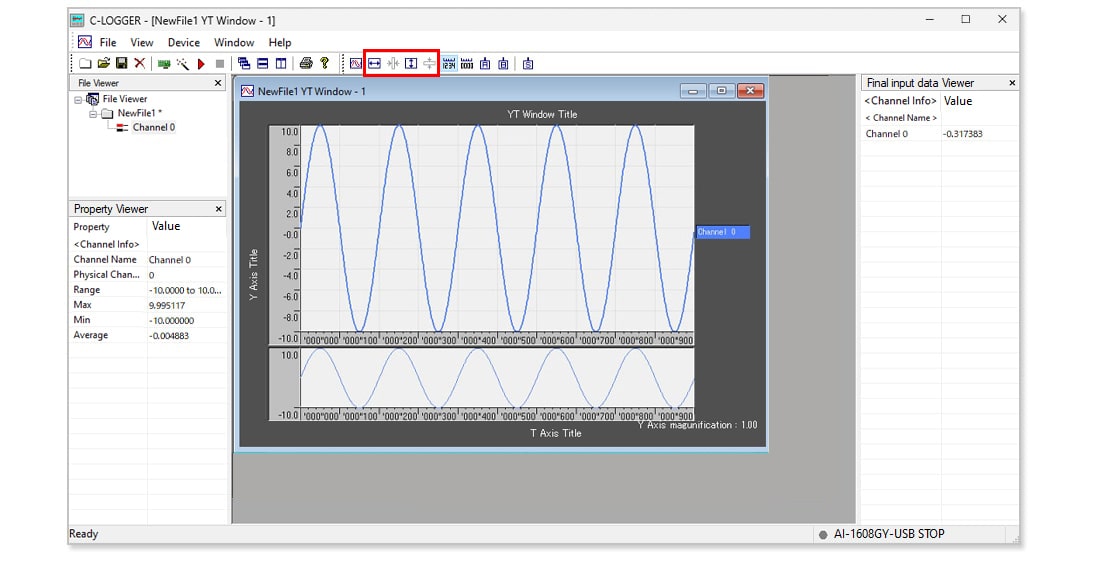
●Zoom in/out display of graphs
Measured data can be made easier to view by zoom in/out function.
This function is ideal when checking the details of a range that appears to be abnormal.
Click these icons on the toolbar to change the display of the graph
 |
T-axis zoom in |
 |
T-axis zoom out |
 |
Y-axis zoom in |
 |
Y-axis zoom out |
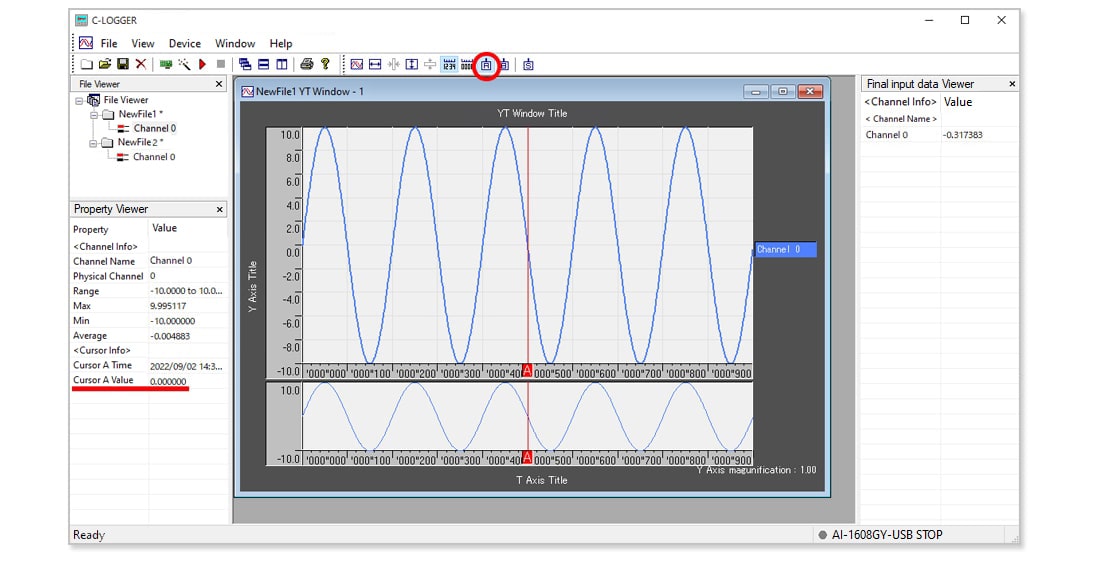
●AB cursor function
Let’s check the graph and read the values. The cursor function is convenient because it is difficult to read the exact values from the graphical depiction alone.
Cursor  is displayed by clicking the icon on the toolbar. <Cursor Info> is added to the Property Viewer on the left side of the window, so the value of cursor A can be read.
The cursor A value was read to be 0.000000.
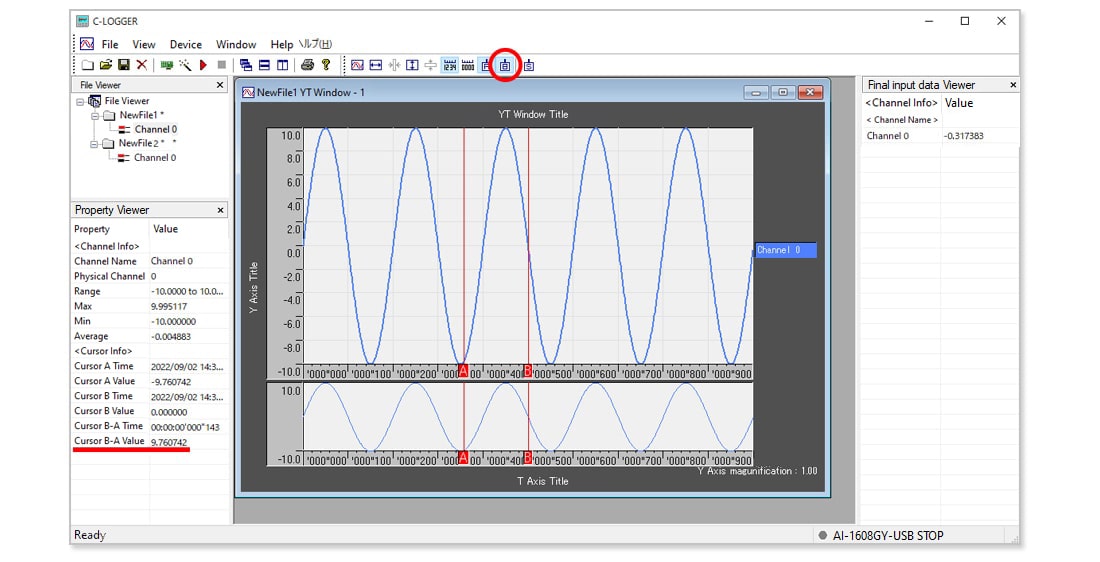
Clicking on the icon also displays cursor  , allowing you to instantly examine the difference between cursors A and B.
3.5 Save to PC as CSV file
Select “File (F)” - “Save As (A).”
Select the save destination.
Specify CSV file from the File types and name the file.
Click the Save button to save the data recorded on the PC in CSV format.
The acquired data is recorded directly on the PC, eliminating the need for data transfer, etc.
Device used here
AI-1608GY-USB
- Input 4μsec/ch、8ch、16bit resolution
- Complies with the USB1.1 and USB2.0 standards and is driven by bus power, eliminating the need for an external power supply
- Capable of sampling by various trigger conditions and clocks
- Equipped with buffer memory for FIFO or ring memory usage
- Windows and Linux driver libraries are included
- Equipped with software calibration function