Preventing Heatstroke - Establishment of an Environmental Monitoring System to Ensure a Comfortable Work Environment
In recent years, transitioning to a decarbonized society has become a major social issue in the fight against climate change. Environmental problems have had a major impact on our living environment, with several “once in a decade” disasters occurring with greater frequency. Environmental monitoring is becoming increasingly important in minimizing the damage caused by such disasters and determining countermeasures. There is also a growing trend for acquiring and analyzing data from various environmental sensors using the Internet of Things (IoT). Building these IoT-based environmental monitoring systems requires not only collecting information from existing environmental sensors but also solving various issues, including incorporating new sensors and improving the quality of the gathered data.
The following blog entry introduces how to use Contec’s CONPROSYS IoT solutions to easily build environmental monitoring systems for creating a comfortable work environment.
Contents
Equipment used for environmental monitoring
Environmental monitoring systems using CONPROSYS are configured as follows.
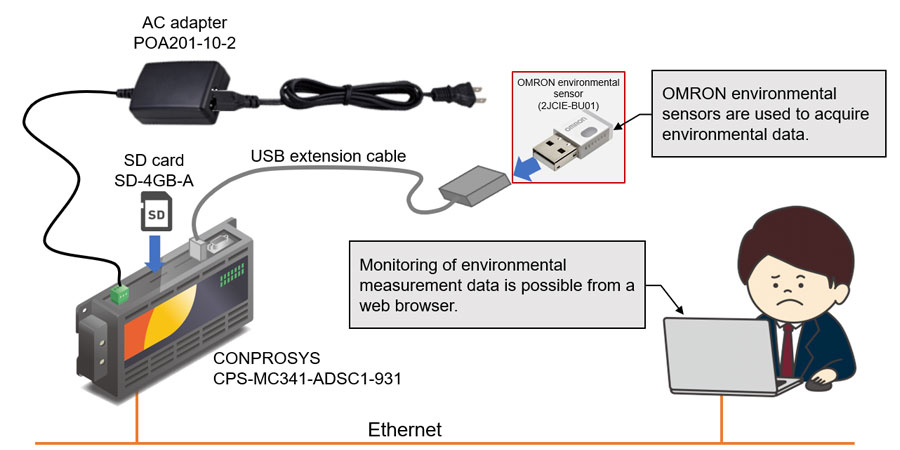 Fig. 1 - Environmental monitoring system configuration
CONPROSYS is an information device that can easily collect the data necessary for IoT, process decisions based on the data, and visualize the data even from remote locations. This environmental monitoring system uses the CPS-MC341-ADSC1-931 M2M controller, but any M2M Controller Series or M2M Gateway Series model can be used.
- Built-in OPC UA server function
- Measurement/uploading (HTTPS/FTP)
- Web monitoring (with HMI function)
- Web task scripts (with VTC function)
- Support for ambient temperatures of -20°C to +60°C
CPS-MC341-ADSC1-931 Specifications
The OMRON environmental sensor (2JCIE-BU01) used here is powered by a USB port and can measure the surrounding environment and transmit data via USB or Bluetooth communication.
2JCIE-BU01 specifications
2JCIE-BU01 performance
Management of heat index (WBGT) to prevent heatstroke
The heat index (wet bulb globe temperature, or WBGT) is the index proposed in the US in 1954 for preventing heatstroke. This index is now recognized as an effective guideline for workplace working environments and has been standardized as an international standard in ISO 7243. In Japan, the Japanese Industrial Standard (JIS) Z 8504 is listed as “Hot environments — Estimation of the heat stress on working man, based on the WBGT-index (wet bulb globe temperature).”
Unlike the air temperature, the WBGT is a numerical value that comprehensively evaluates temperature, humidity, radiant heat (heat emitted from the ground, buildings, and the body), and airflow. Values are expressed in degrees Celsius (°C), the same unit as air temperature.
[Calculating WBGT]
Outdoors: WBGT = 0.7 × Wet bulb temperature + 0.2 × Black globe temperature + 0.1 × Dry bulb temperature
Indoors: WBGT = 0.7 × Wet bulb temperature + 0.3 × Black globe temperature
A WBGT thermometer is an accurate device for determining the WBGT value, but the Japanese Ministry of the Environment also offers a heatstroke prevention website with site-specific information. In addition, WBGT values can also be calculated using the relationship table (Fig. 2) if temperature and humidity are known.
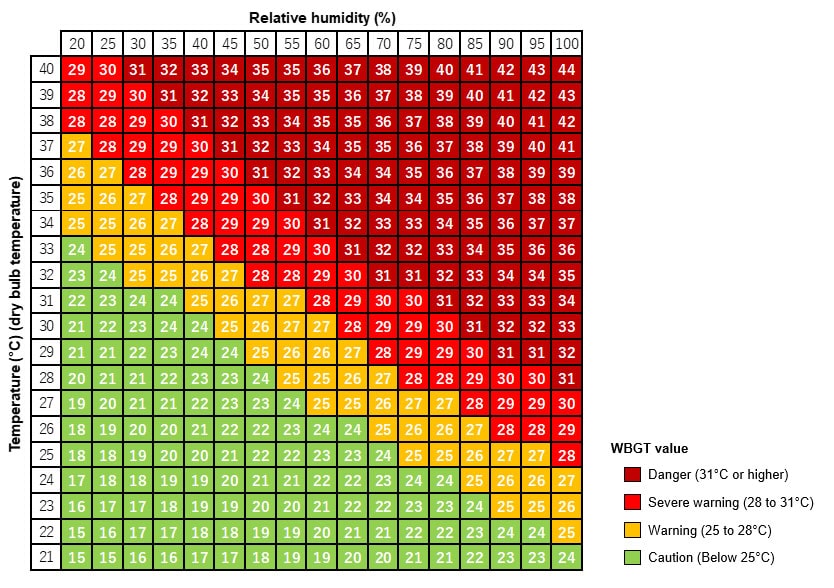 Fig. 2: Relationship table between WBGT value and temperature and relative humidity
If the WBGT exceeds 28°C, incidences of heatstroke are known to increase sharply. The table below outlines the recommended guidelines for daily life under certain WBGT values.
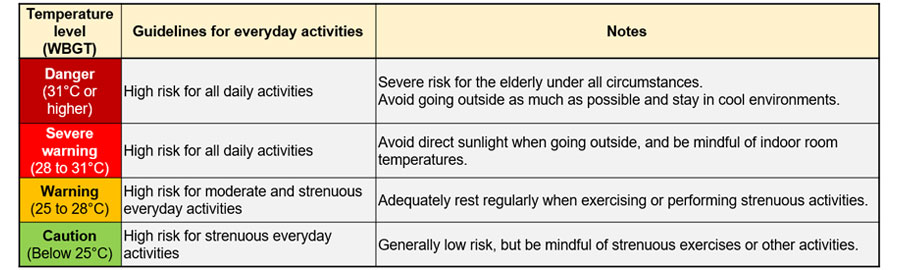 WBGT guidelines for prevention of heat disorders in everyday life
Management of discomfort index to ensure comfortableness of work environment
Even at high temperatures such as in summer, dry environments can feel comfortable while humid environments can feel uncomfortable. It can also be very uncomfortable to use air conditioners on high-temperature rainy days, such as during Japan’s rainy season. The degree of heat felt by the human body depends on not only temperature but also wind and humidity. A simple quantification of this physically experienced temperature is called the discomfort index.
The discomfort index can be calculated from the temperature and humidity using the following equation.
Discomfort index = 0.81 × Temperature + 0.01 × Humidity (%) × (0.99 × Temperature − 14.3) + 46.3
The number of people who feel uncomfortable gradually increases if the discomfort index exceeds 70, with half the people feeling uncomfortable if the index rises above 75, and most people feeling uncomfortable if the index passes 80. However, because the heat and humidity felt physically depend not only on temperature and humidity but also wind speed and other conditions, the discomfort index may not necessarily match the body’s physical experience. This is explained by the color-coded table shown in Fig. 3.
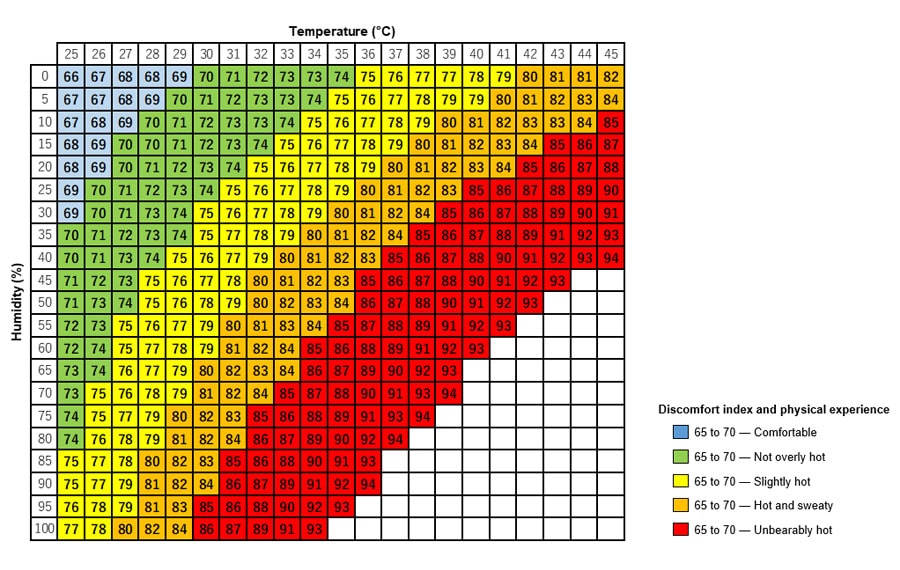 Fig. 3: Discomfort index figures
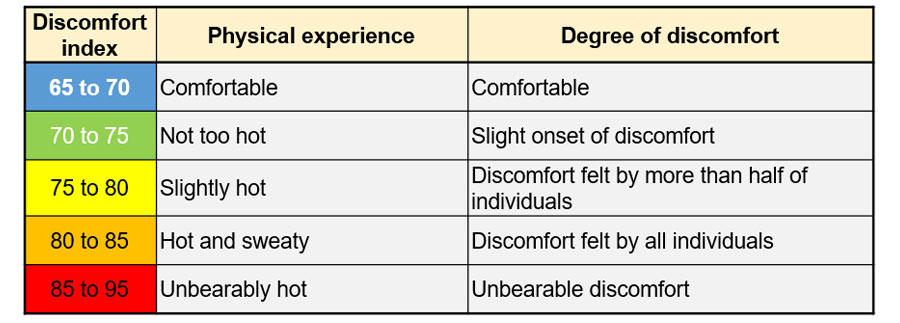 Discomfort index and the degree of discomfort
Achieving a comfortable work environment while also saving energy is possible by balancing temperature and humidity while paying close attention to the discomfort index.
Ventilation measures to prevent novel coronavirus infections
Japan’s Ministry of Health, Labour and Welfare (MHLW) recommends avoiding the “Three Cs” (closed spaces, crowded places, and close-contact settings), wearing masks, and practicing frequent handwashing and gargling as countermeasures against infections of the novel coronavirus. Changes in working style and habits, including promotion of telecommuting and the use of take-out, highlight the effects of the pandemic on our daily lives.
These changes are the result of attention to ventilation measures to keep indoor environments hygienic to minimize exposure in closed spaces with poor ventilation. As a standard for proper ventilation, the MHLW has proposed a CO2 concentration of no more than 1,000 ppm (Fig. 4).
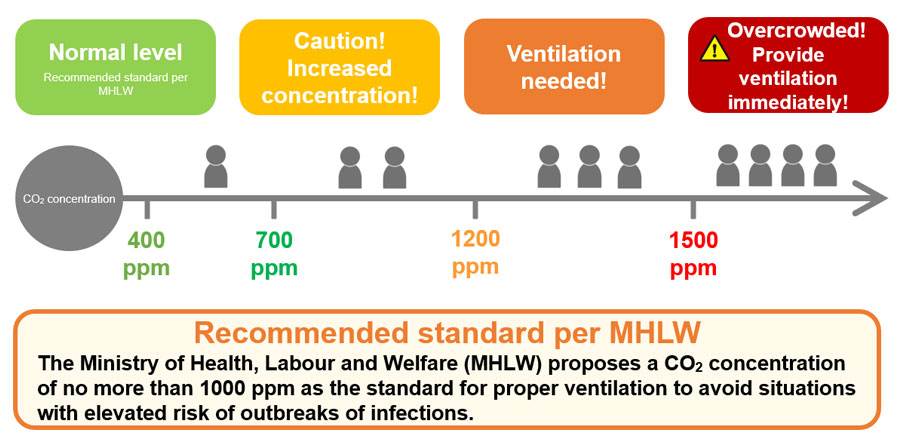 Fig. 4: CO2 concentration standard levels for preventing infection
Because CO2 cannot be seen in offices and meeting rooms where employees gather, measurement of the CO2 concentration with a CO2 sensor is necessary to ensure appropriate ventilation measures.
The indoor CO2 concentration should not exceed 1000 ppm in buildings (according to the MHLW’s Standards for Environment and Health Management of Buildings) or 1500 ppm in educational facilities (according to the Ministry of Education, Culture, Sports, Science and Technology’s Standards for School Environment and Health). The American Society of Heating, Refrigerating and Air-Conditioning Engineers also recommends a concentration of no more than 1000 ppm.
These standards have been set based on the negative effects of elevated CO2 levels on the human body. Although even CO2 concentrations of around 2000 ppm are not toxic, concentrations above 1500 ppm can cause drowsiness and discomfort, which can significantly impact work efficiency. At concentrations above 3000 ppm, headache, dizziness, and nausea are not uncommon, and at concentrations above 5000 ppm, loss of consciousness may occur (Fig. 5).
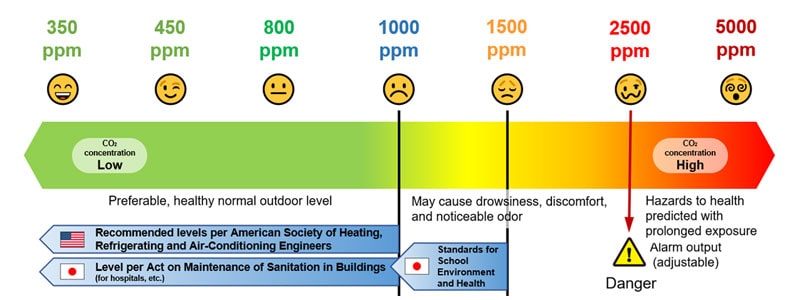 Fig. 5 : CO2 concentration control criteria
Controlling CO2 concentration through proper ventilation is believed to be effective at not only preventing novel coronavirus infections but also increasing concentration in working environments for improving business performance.
Connecting CONPROSYS and environmental sensors
The environmental monitoring system introduced here uses environmental sensors manufactured by OMRON. These environmental sensors are connected to a CONPROSYS device via USB communication for acquiring measurement data.
Preparations for measurement included saving a program made using the extended SDK function to communicate with the environmental sensors onto an SD card that was then inserted into the CONPROSYS unit.
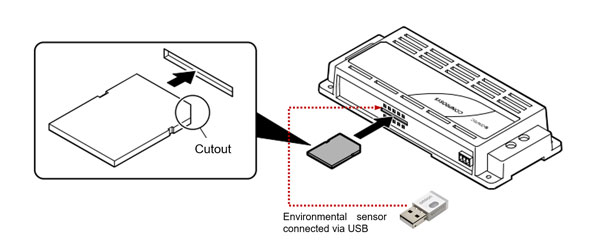
The environmental sensor also includes a sensor on the side for measuring illuminance. A USB extension cable connected to the USB port on the CONPROSYS device is used so that the environmental sensor can be positioned and installed in any direction. When obtaining the illuminance of a desktop, for example, the sensor must be installed so that it faces upward.
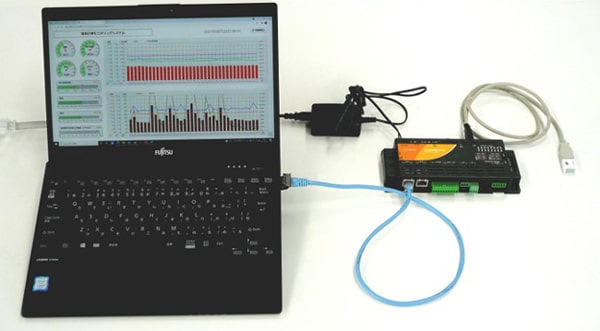 Installation setup
Software setup (Script Sample Programs)
The collection of VTC script sample programs highlights the knowledge necessary for utilizing IoT with CONPROSYS devices. The simple instructions make it easy for users to explore and use the downloadable programs in various ways.
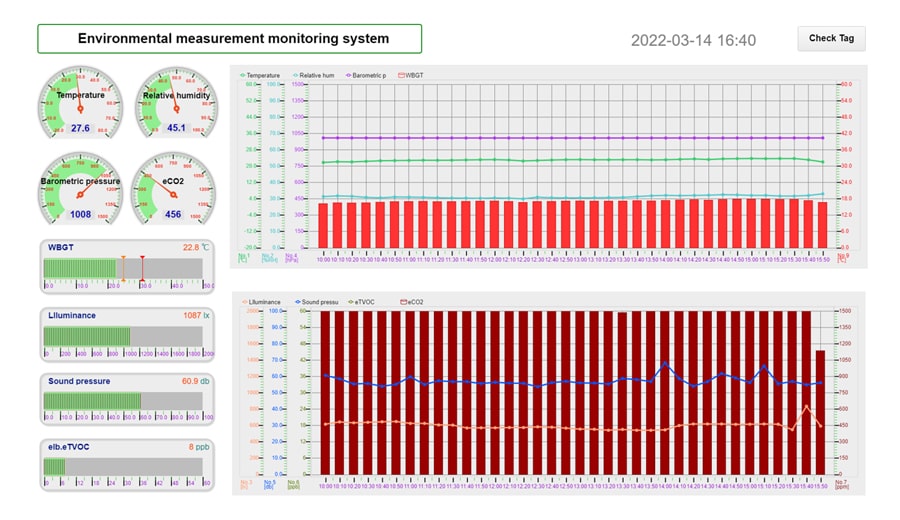
The “Environmental Monitoring System” scripts can be downloaded from the CONPROSYS VTC Script Sample Programs* . Follow the instructions in the sample task to set up the program in CONPROSYS. After the monitoring screen is displayed, the measured environmental data values will be displayed on the screen as shown below.
HMI screen (visualization) customization
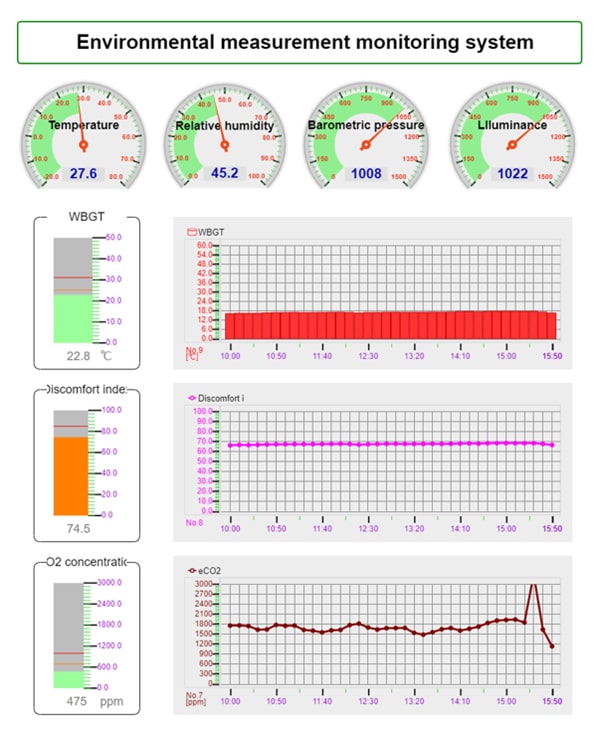
The sample screen is designed to display as much measured data as possible. This may make determining which data to prioritize for management difficult. Customizing the sample screen allows users to create a screen that makes focusing on the data easier for maintaining a comfortable work environment—the topic of this blog.
The following screen examples display heatstroke risk, discomfort index, and CO2 concentration in bar graphs with colors that change depending on the threshold. The measured data is also displayed in a line graph. Contec’s CONPROSYS makes it possible to create such screens just as with drawing software.
Conclusion
CONPROSYS products combine hardware that can be used with confidence thanks to superior reliability and a stable, long-term supply that ensures stable operation even in industrial applications, and software that offers convenient functions for utilizing IoT in various locations. CONPROSYS devices can be easily used for monitoring and as a gateway to cloud services quickly after installation.
Contec remains dedicated to proposing indispensable products for today’s evolving IoT-based society. Stay tuned to see what else we have to offer!
Related Links